
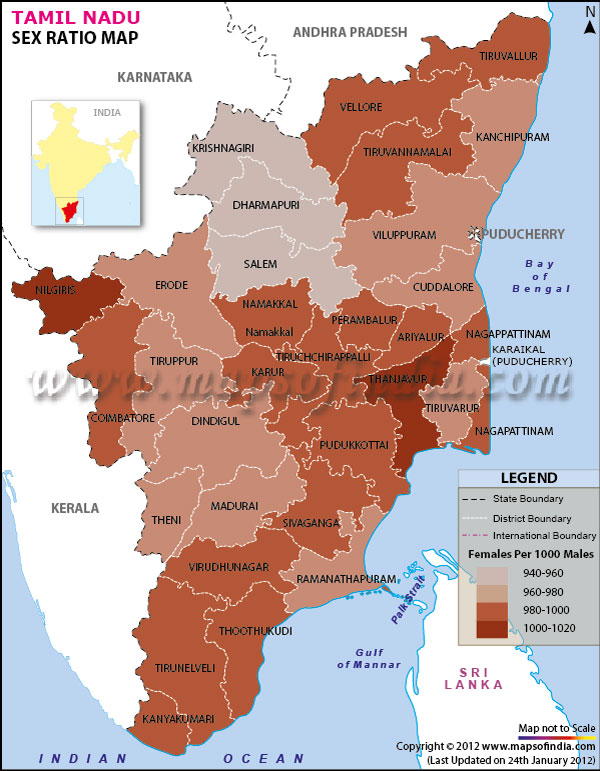
| *The Map showing sex ratio in Tamil Nadu as per 2011 census of India. |
| Disclaimer: All efforts have been made to make this image accurate. However Mapping Digiworld Pvt Ltd and its directors do not own any responsibility for the correctness or authenticity of the same. |
As per the 2011 Census, Tamil Nadu has a total population of 72,138,958. In the previous census of 2001 it had a population of 62,405,679.
The total male population of Tamil Nadu is 36,158,871 and the total female population is 35,980,087. The population growth since the last census was 15.60 percent and the total population of the state forms 5.96 percent of the entire population in India. The area of Tamil Nadu is 130,058 sq. km with a Density of 555 per sq km.
The Sex Ratio in Tamil Nadu is 995 for each 1000 male and has increased since the last census in which it was 986 per 1000 males. The child sex ratio is 946 per 1000 males and has decreased as compared to 959 in the last census. The Literacy rate in Tamil Nadu is 80.33 percent, with male and female literacy at 86.81 and 73.86 percent respectively. In figures, the total literates in Tamil Nadu are 52,413,116 out of which 28,314,595 are males and 24,098,521 are females.
The table provides district wise figures of population, growth, sex ratio, literacy and density in Tamil Nadu.
| District | Population | Male population | Female population | Growth | Sex ratio | Literacy | Density |
|---|---|---|---|---|---|---|---|
| Ariyalur | 752481 | 373319 | 379162 | 8.19 | 1016 | 71.99 | 387 |
| Chennai | 4681087 | 2357633 | 2323454 | 7.77 | 986 | 90.33 | 26903 |
| Coimbatore | 3472578 | 1735362 | 1737216 | 18.46 | 1001 | 84.31 | 748 |
| Cuddalore | 2600880 | 1311151 | 1289729 | 13.8 | 984 | 79.04 | 702 |
| Dharmapuri | 1502900 | 772490 | 730410 | 16.04 | 946 | 64.71 | 332 |
| Dindigul | 2161367 | 1081934 | 1079433 | 12.39 | 998 | 76.85 | 357 |
| Erode | 2259608 | 1134191 | 1125417 | 12.05 | 992 | 72.96 | 397 |
| Kancheepuram | 3990897 | 2010309 | 1980588 | 38.69 | 985 | 85.29 | 927 |
| Kanniyakumari | 1863174 | 926800 | 936374 | 11.17 | 1010 | 92.14 | 1106 |
| Karur | 1076588 | 534392 | 542196 | 15.06 | 1015 | 75.86 | 371 |
| Krishnagiri | 1883731 | 963152 | 920579 | 20.67 | 956 | 72.41 | 370 |
| Madurai | 3041038 | 1528308 | 1512730 | 17.95 | 990 | 81.66 | 823 |
| Nagapattinam | 1614069 | 797214 | 816855 | 8.41 | 1025 | 84.09 | 668 |
| Namakkal | 1721179 | 866740 | 854439 | 15.25 | 986 | 74.92 | 506 |
| Perambalur | 564511 | 281436 | 283075 | 14.36 | 1006 | 74.68 | 323 |
| Pudukkottai | 1618725 | 803337 | 815388 | 10.9 | 1015 | 77.76 | 348 |
| Ramanathapuram | 1337560 | 676574 | 660986 | 12.63 | 977 | 81.48 | 320 |
| Salem | 3480008 | 1780569 | 1699439 | 15.37 | 954 | 73.23 | 663 |
| Sivaganga | 1341250 | 670597 | 670653 | 16.09 | 1000 | 80.46 | 324 |
| Thanjavur | 2402781 | 1183112 | 1219669 | 8.42 | 1031 | 82.72 | 691 |
| The Nilgiris | 735071 | 360170 | 374901 | -3.55 | 1041 | 85.65 | 288 |
| Theni | 1243684 | 624922 | 618762 | 13.69 | 990 | 77.62 | 433 |
| Thiruvallur | 3725697 | 1878559 | 1847138 | 35.25 | 983 | 83.82 | 1049 |
| Thiruvarur | 1268094 | 627616 | 640478 | 8.43 | 1020 | 83.26 | 533 |
| Thoothukkudi | 1738376 | 858919 | 879457 | 9.14 | 1024 | 86.52 | 378 |
| Tiruchirappalli | 2713858 | 1347863 | 1365995 | 12.22 | 1013 | 83.56 | 602 |
| Tirunelveli | 3072880 | 1518595 | 1554285 | 13.66 | 1024 | 82.92 | 458 |
| Tiruppur | 2471222 | 1242974 | 1228248 | 29.69 | 988 | 79.1 | 476 |
| Tiruvannamalai | 2468965 | 1238688 | 1230277 | 12.94 | 993 | 74.72 | 399 |
| Vellore | 3928106 | 1959676 | 1968430 | 12.96 | 1004 | 79.65 | 646 |
| Viluppuram | 3463284 | 1744832 | 1718452 | 16.99 | 985 | 72.08 | 482 |
| Virudhunagar | 1943309 | 967437 | 975872 | 10.96 | 1009 | 80.75 | 454 |
| District | Female per thousand male |
|---|---|
| Dharmapuri | 946 |
| Salem | 954 |
| Krishnagiri | 956 |
| Ramanathapuram | 977 |
| Thiruvallur | 983 |
| Cuddalore | 984 |
| Viluppuram | 985 |
| Kancheepuram | 985 |
| Chennai | 986 |
| Namakkal | 986 |
| Tiruppur | 988 |
| Madurai | 990 |
| Theni | 990 |
| Erode | 992 |
| Tiruvannamalai | 993 |
| Dindigul | 998 |
| Sivaganga | 1000 |
| Coimbatore | 1001 |
| Vellore | 1004 |
| Perambalur | 1006 |
| Virudhunagar | 1009 |
| Kanniyakumari | 1010 |
| Tiruchirappalli | 1013 |
| Karur | 1015 |
| Pudukkottai | 1015 |
| Ariyalur | 1016 |
| Thiruvarur | 1020 |
| Tirunelveli | 1024 |
| Thoothukkudi | 1024 |
| Nagapattinam | 1025 |
| Thanjavur | 1031 |
| The Nilgiris | 1041 |