Karnataka Sex Ratio

Buy Now  custom maps zoom map

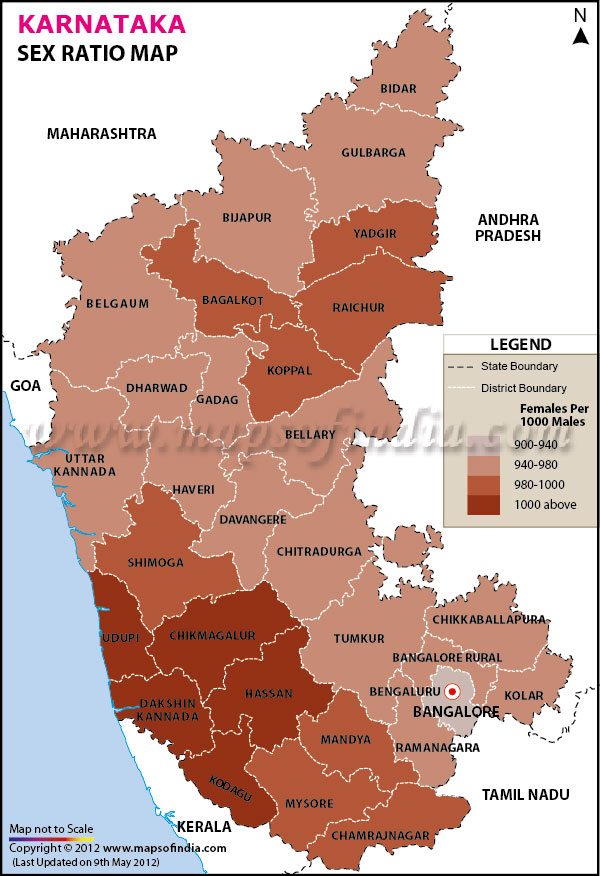
*The Map showing sex ratio in Karnataka as per 2011 census of India. Map highlights the females per thousand males.
Disclaimer: All efforts have been made to make this image accurate. However Mapping Digiworld Pvt Ltd and its directors do not own any responsibility for the correctness or authenticity of the same.

As per the 2011 Census, Karnataka has a total population of 61,130,704; previously it was 52,850,562 in the 2001 Census. From the total population of Karnataka, the male population is 31,057,742 and the female population is 30,072,962. The population growth since the last census was 15.67 percent and the whole population of the state forms 5.05 percent of the entire population in India. The area of Karnataka is 191,791 sq. km with a Density of 319 per sq km.

The Sex Ratio in Karnataka is 968 for each 1000 male and has increased since the last census of 2001 in which it was 964 per 1000 males. The child sex ratio is 943 per 1000 males and has decreased as compared to 973 in the 2001 census. The Literacy rate in Karnataka is 75.60 percent, with male literacy at 82.85 percent and female literacy at 68.13 percent. In figures, the total literates in Karnataka are 41,029,323 out of which 22,808,468 are males and 18,220,855 are females.

The following is an informative table which provides district wise figures of population, growth, sex ratio, literacy and density in Karnataka.

District Population Male population Female population Growth Sex ratio Literacy Density
Bagalkot 1890826 952902 937924 14.46 984 69.39 288
Bangalore 9588910 5025498 4563412 46.68 908 88.48 4378
Bangalore Rural 987257 507514 479743 16.02 945 78.29 441
Belgaum 4778439 2427104 2351335 13.38 969 73.94 356
Bellary 2532383 1280402 1251981 24.92 978 67.85 300
Bidar 1700018 870850 829168 13.16 952 71.01 312
Bijapur 2175102 1112953 1062149 20.38 954 67.2 207
Chamarajanagar 1020962 513359 507603 5.75 989 61.12 200
Chikkaballapura 1254377 637504 616873 9.17 968 70.08 298
Chikmagalur 1137753 567483 570270 -0.28 1005 79.24 158
Chitradurga 1660378 843411 816967 9.39 969 73.82 197
Dakshina Kannada 2083625 1032577 1051048 9.8 1018 88.62 457
Davanagere 1946905 989602 957303 8.71 967 76.3 329
Dharwad 1846993 939127 907866 15.13 967 80.3 434
Gadag 1065235 538477 526758 9.61 978 75.18 229
Gulbarga 2564892 1307061 1257831 17.94 962 65.65 233
Hassan 1776221 885807 890414 3.17 1005 75.89 261
Haveri 1598506 819295 779211 11.08 951 77.6 331
Kodagu 554762 274725 280037 1.13 1019 82.52 135
Kolar 1540231 779401 760830 11.04 976 74.33 384
Koppal 1391292 701479 689813 16.32 983 67.28 250
Mandya 1808680 909441 899239 2.55 989 70.14 365
Mysore 2994744 1511206 1483538 13.39 982 72.56 437
Raichur 1924773 966493 958280 15.27 992 60.46 228
Ramanagara 1082739 548060 534679 5.06 976 69.2 303
Shimoga 1755512 879817 875695 6.88 995 80.5 207
Tumkur 2681449 1354770 1326679 3.74 979 74.32 253
Udupi 1177908 562896 615012 5.9 1093 86.29 304
Uttara Kannada 1436847 727424 709423 6.15 975 84.03 140
Yadgir 1172985 591104 581881 22.67 984 52.36 224


District Female per thousand male
BANGALORE 908
BANGALORE RURAL 945
HAVERI 951
BIDAR 952
BIJAPUR 954
GULBARGA 962
DHARWAD 967
DAVANAGERE 967
CHIKKABALLAPURA 968
CHITRADURGA 969
BELGAUM 969
UTTARA KANNADA 975
RAMANAGARA 976
KOLAR 976
BELLARY 978
GADAG 978
TUMKUR 979
MYSORE 982
KOPPAL 983
BAGALKOT 984
YADGIR 984
MANDYA 989
CHAMARAJANAGAR 989
RAICHUR 992
SHIMOGA 995
CHIKMAGALUR 1,005
HASSAN 1,005
DAKSHINA KANNADA 1,018
KODAGU 1,019
UDUPI 1,093