Jharkhand Sex Ratio

Buy Now  custom maps zoom map

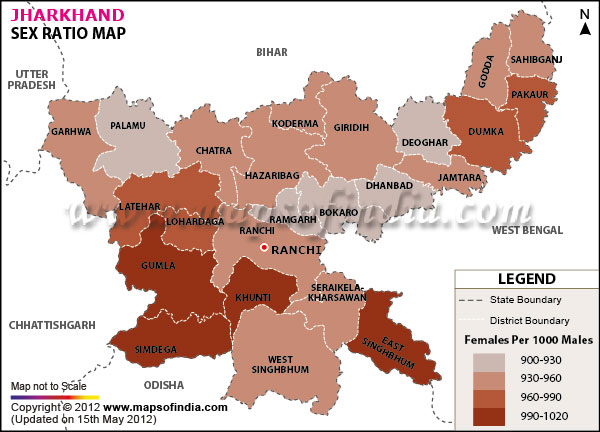
*The Map showing sex ratio in Jharkhand as per 2011 census of India. Map highlights the females per thousand males.
Disclaimer: All efforts have been made to make this image accurate. However Mapping Digiworld Pvt Ltd and its directors do not own any responsibility for the correctness or authenticity of the same.

According to the 2011 Census, the total population of Jharkhand is 32,966,238. Previously, the population was 26,945,829 in the 2001 Census.

The male and female population from the entire population of Jharkhand is 16,931,688 and 16,034,550 respectively. The total population growth since the last census was 22.34 percent and the population of the state forms 2.72 percent of the entire population in India. Jharkhand has an area of 79,714 sq. km with a Density of 414 per sq km. The Sex Ratio in Jharkhand is 947 for each 1000 male and has increased from 941 per 1000 males since the last census of 2001. The child sex ratio is 943 per 1000 males and has decreased as compared to 966 in the 2001 census. Jharkhand has a Literacy rate of 67.63 percent, with male literacy at 78.45 percent and female literacy at 56.21 percent. In figures, the total literates in Jharkhand are 18,753,660 out of which the males are 11,168,649 and females are 7,585,011. The informative table provides district wise figures of population, growth, sex ratio, literacy and density in Jharkhand.

District Population Male population Female population Growth Sex ratio Literacy Density
Bokaro 2061918 1076270 985648 15.99 916 73.48 716
Chatra 1042304 534209 508095 28.98 951 62.14 275
Deoghar 1491879 776741 715138 28.02 921 66.34 602
Dhanbad 2682662 1405847 1276815 11.91 908 75.71 1284
Dumka 1321096 669240 651856 19.39 974 62.54 300
Garhwa 1322387 683984 638403 27.71 933 62.18 327
Giridih 2445203 1258607 1186596 28.33 943 65.12 497
Godda 1311382 678504 632878 25.14 933 57.68 622
Gumla 1025656 514730 510926 23.21 993 66.92 193
Hazaribagh 1734005 891179 842826 25.75 946 70.48 403
Jamtara 790207 403450 386757 21 959 63.73 439
Khunti 530299 265939 264360 21.96 994 64.51 215
Kodarma 717169 367952 349217 32.59 949 68.35 427
Latehar 725673 369534 356139 29.38 964 61.23 200
Lohardaga 461738 232575 229163 26.67 985 68.29 310
Pakur 899200 453101 446099 28.15 985 50.17 498
Palamu 1936319 1003876 932443 25.94 929 65.5 381
Pashchimi Singhbhum 1501619 749314 752305 21.69 1004 59.54 209
Purbi Singhbhum 2291032 1175696 1115336 15.53 949 76.13 648
Ramgarh 949159 494037 455122 13.06 921 73.92 684
Ranchi 2912022 1493376 1418646 23.9 950 77.13 557
Sahibganj 1150038 590390 559648 23.96 948 53.73 719
Saraikela Kharsawan 1063458 543232 520226 25.28 958 68.85 390
Simdega 599813 299905 299908 16.62 1000 67.59 160


District Female per thousand male
Dhanbad 908
Bokaro 916
Deoghar 921
Ramgarh 921
Palamu 929
Garhwa 933
Godda 933
Giridih 943
Hazaribagh 946
Sahibganj 948
Kodarma 949
Purbi Singhbhum 949
Ranchi 950
Chatra 951
Saraikela-Kharsawan 958
Jamtara 959
Latehar 964
Dumka 974
Pakur 985
Lohardaga 985
Gumla 993
Khunti 994
Simdega 1000
Pashchimi Singhbhum 1004