
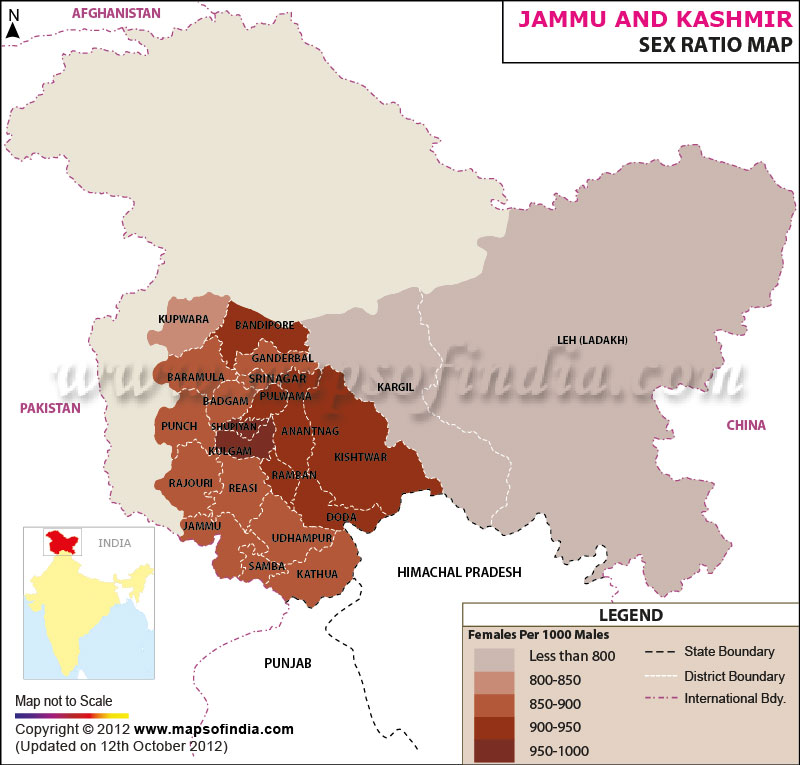
| *The Map showing sex ratio in Jammu & Kashmir as per 2011 census of India. Map highlights the females per thousand males. |
| Disclaimer: All efforts have been made to make this image accurate. However Mapping Digiworld Pvt Ltd and its directors do not own any responsibility for the correctness or authenticity of the same. |
As per the 2011 Census, Jammu and Kashmir has a total population of 12,548,926; previously it was 10,143,700 in the 2001 Census.
From the total population of Jammu & Kashmir, the male population is 6,665,561 and the female population is 5,883,365. The population growth since the last census was 23.71 percent and the whole population of the state forms 1.04 percent of the entire population in India. The area of Jammu and Kashmir is 222,236 sq. km with a Density of 56 per sq km.
The Sex Ratio in Jammu and Kashmir is 883 for each 1000 male and has decreased since the last census of 2001 in which the sex ratio was 900 per 1000 males. The child sex ratio is 859 per 1000 males and has also decreased as compared to 964 in the 2001 census. The Literacy rate in Jammu and Kashmir is 68.74 percent, with male literacy at 78.26 percent and female literacy at 58.01 percent. In figures, the total literates in Jammu and Kashmir are 7,245,053 out of which 4,370,604 are males and 2,874,449 are females.
The following is an informative table which provides district wise figures of population, growth, sex ratio, literacy and density in Jammu and Kashmir.
| District | Population | Male Population | Female population | Growth | Sex ratio | Literacy | Density |
|---|---|---|---|---|---|---|---|
| Anantnag | 1070144 | 552404 | 517740 | 37.48 | 937 | 64.32 | 375 |
| Badgam | 735753 | 390705 | 345048 | 21.18 | 883 | 57.98 | 537 |
| Bandipora | 385099 | 201531 | 183568 | 26.31 | 911 | 57.82 | 1117 |
| Baramula | 1015503 | 542171 | 473332 | 20.34 | 873 | 66.93 | 305 |
| Doda | 409576 | 213091 | 196485 | 27.89 | 922 | 65.97 | 79 |
| Ganderbal | 297003 | 158900 | 138103 | 36.3 | 869 | 59.99 | 1151 |
| Jammu | 1526406 | 815727 | 710679 | 12.48 | 871 | 83.98 | 596 |
| Kargil | 143388 | 80791 | 62597 | 20.18 | 775 | 74.49 | 10 |
| Kathua | 615711 | 327953 | 287758 | 20.38 | 877 | 73.5 | 232 |
| Kishtwar | 231037 | 120496 | 110541 | 21.06 | 917 | 58.54 | 125 |
| Kulgam | 422786 | 216672 | 206114 | 7.3 | 951 | 60.35 | 925 |
| Kupwara | 875564 | 475126 | 400438 | 34.62 | 843 | 66.92 | 368 |
| Leh | 147104 | 92907 | 54197 | 25.48 | 583 | 80.48 | 3 |
| Pulwama | 570060 | 297988 | 272072 | 29.18 | 913 | 65 | 598 |
| Punch | 476820 | 252240 | 224580 | 27.97 | 890 | 68.69 | 285 |
| Rajouri | 619266 | 332424 | 286842 | 28.14 | 863 | 68.54 | 235 |
| Ramban | 283313 | 149032 | 134281 | 31.81 | 901 | 56.9 | 213 |
| Reasi | 314714 | 166392 | 148322 | 27.06 | 891 | 59.42 | 184 |
| Samba | 318611 | 168948 | 149663 | 16.9 | 886 | 82.48 | 318 |
| Shupiyan | 265960 | 136302 | 129658 | 25.85 | 951 | 62.49 | 852 |
| Srinagar | 1269751 | 675667 | 594084 | 23.56 | 879 | 71.21 | 703 |
| Udhampur | 555357 | 298094 | 257263 | 20.86 | 863 | 69.9 | 211 |
| District | Female per thousand male |
|---|---|
| Leh | 583 |
| Kargil | 775 |
| Kupwara | 843 |
| Rajouri | 863 |
| Udhampur | 863 |
| Ganderbal | 869 |
| Jammu | 871 |
| Baramula | 873 |
| Kathua | 877 |
| Srinagar | 879 |
| Badgam | 883 |
| Samba | 886 |
| Punch | 890 |
| Reasi | 891 |
| Ramban | 901 |
| Bandipore | 911 |
| Pulwama | 913 |
| Kishtwar | 917 |
| Doda | 922 |
| Anantnag | 937 |
| Shupiyan | 951 |
| Kulgam | 951 |