
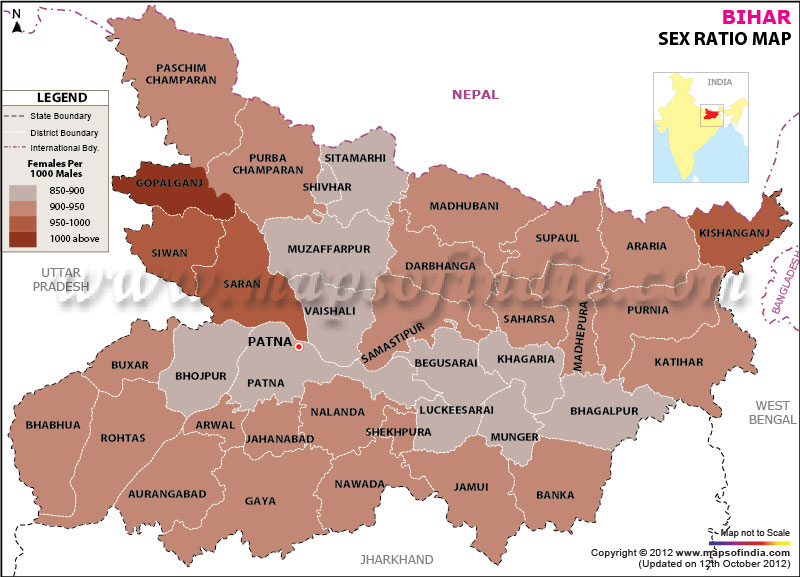
| *The Map showing sex ratio in Bihar as per 2011 census of India. Map highlights the females per thousand males. |
| Disclaimer: All efforts have been made to make this image accurate. However Mapping Digiworld Pvt Ltd and its directors do not own any responsibility for the correctness or authenticity of the same. |
As per the 2011 Census, Bihar has a total population of 103,804,637; previously it was 82,998,509 in 2001.
Out of the total population of Bihar, the male population is 54,185,347 and the female population is 49,619,290. The total population growth was 25.07 percent since the last census and the population of the state forms 8.58 percent of the total population in India. The total area of Bihar is 94,163 sq. km with a Density of 1,102 per sq km.
The Sex Ratio in Bihar is 916 for each 1000 male. In the last census of 2001, the sex ratio was 921 per 1000 males in Bihar. The child sex ratio is 933 per 1000 males and has increased as compared to 908 in the 2001 census. The Literacy rate in Bihar has risen and is 63.82 percent, with male literacy at 73.39 percent and female literacy at 53.33 percent. In actual figures, total literates in Bihar are 54,390,254 out of which males are 32,711,975 and females are 21,678,279.
The following table provides district wise data of population, growth, sex ratio, literacy and density in Bihar.
| District | Population | Male Population | Female Population | Growth | Sex ratio | Literacy | Density |
|---|---|---|---|---|---|---|---|
| Araria | 2806200 | 1460878 | 1345322 | 30 | 921 | 55.1 | 992 |
| Arwal | 699563 | 362945 | 336618 | 19.01 | 927 | 69.54 | 1099 |
| Aurangabad | 2511243 | 1310867 | 1200376 | 24.75 | 916 | 72.77 | 760 |
| Banka | 2029339 | 1064307 | 965032 | 26.14 | 907 | 60.12 | 672 |
| Begusarai | 2954367 | 1560203 | 1394164 | 25.75 | 894 | 66.23 | 1540 |
| Bhagalpur | 3032226 | 1614014 | 1418212 | 25.13 | 879 | 64.96 | 1180 |
| Bhojpur | 2720155 | 1431722 | 1288433 | 21.27 | 900 | 72.79 | 1136 |
| Buxar | 1707643 | 888356 | 819287 | 21.77 | 922 | 71.77 | 1003 |
| Darbhanga | 3921971 | 2053043 | 1868928 | 19 | 910 | 58.26 | 1721 |
| Gaya | 4379383 | 2266865 | 2112518 | 26.08 | 932 | 66.35 | 880 |
| Gopalganj | 2558037 | 1269677 | 1288360 | 18.83 | 1015 | 67.04 | 1258 |
| Jamui | 1756078 | 914368 | 841710 | 25.54 | 921 | 62.16 | 567 |
| Jehanabad | 1124176 | 586202 | 537974 | 21.34 | 918 | 68.27 | 1206 |
| Kaimur | 1626900 | 847784 | 779116 | 27.54 | 919 | 71.01 | 488 |
| Katihar | 3068149 | 1601158 | 1466991 | 28.23 | 916 | 53.56 | 1004 |
| Khagaria | 1657599 | 880065 | 777534 | 29.46 | 883 | 60.87 | 1115 |
| Kishanganj | 1690948 | 868845 | 822103 | 30.44 | 946 | 57.04 | 898 |
| Lakhisarai | 1000717 | 526651 | 474066 | 24.74 | 900 | 64.95 | 815 |
| Madhepura | 1994618 | 1042373 | 952245 | 30.65 | 914 | 53.78 | 1116 |
| Madhubani | 4476044 | 2324984 | 2151060 | 25.19 | 925 | 60.9 | 1279 |
| Munger | 1359054 | 723280 | 635774 | 19.45 | 879 | 73.3 | 958 |
| Muzaffarpur | 4778610 | 2517500 | 2261110 | 27.54 | 898 | 65.68 | 1506 |
| Nalanda | 2872523 | 1495577 | 1376946 | 21.18 | 921 | 66.41 | 1220 |
| Nawada | 2216653 | 1145123 | 1071530 | 22.49 | 936 | 61.63 | 889 |
| Pashchim Champaran | 3922780 | 2057669 | 1865111 | 28.89 | 906 | 58.06 | 750 |
| Patna | 5772804 | 3051117 | 2721687 | 22.34 | 892 | 72.47 | 1803 |
| Purbi Champaran | 5082868 | 2674037 | 2408831 | 29.01 | 901 | 58.26 | 1281 |
| Purnia | 3273127 | 1695829 | 1577298 | 28.66 | 930 | 52.49 | 1014 |
| Rohtas | 2962593 | 1547856 | 1414737 | 20.22 | 914 | 75.59 | 763 |
| Saharsa | 1897102 | 995502 | 901600 | 25.79 | 906 | 54.57 | 1125 |
| Samastipur | 4254782 | 2228432 | 2026350 | 25.33 | 909 | 63.81 | 1465 |
| Saran | 3943098 | 2023476 | 1919622 | 21.37 | 949 | 68.57 | 1493 |
| Sheikhpura | 634927 | 329593 | 305334 | 20.82 | 926 | 65.96 | 922 |
| Sheohar | 656916 | 347614 | 309302 | 27.32 | 890 | 56 | 1882 |
| Sitamarhi | 3419622 | 1800441 | 1619181 | 27.47 | 899 | 53.53 | 1491 |
| Siwan | 3318176 | 1672121 | 1646055 | 22.25 | 984 | 71.59 | 1495 |
| Supaul | 2228397 | 1157815 | 1070582 | 28.62 | 925 | 59.65 | 919 |
| Vaishali | 3495249 | 1847058 | 1648191 | 28.58 | 892 | 68.56 | 1717 |
| District | Female per thousand male |
|---|---|
| Bihar | 916 |
| Bhagalpur | 879 |
| Munger | 879 |
| Khagaria | 883 |
| Sheohar | 890 |
| Vaishali | 892 |
| Patna | 892 |
| Begusarai | 894 |
| Muzaffarpur | 898 |
| Sitamarhi | 899 |
| Lakhisarai | 900 |
| Bhojpur | 900 |
| Purba Champaran | 901 |
| Pashchim Champaran | 906 |
| Saharsa | 906 |
| Banka | 907 |
| Samastipur | 909 |
| Darbhanga | 910 |
| Madhepura | 914 |
| Rohtas | 914 |
| Katihar | 916 |
| Aurangabad | 916 |
| Jehanabad | 918 |
| Kaimur (Bhabua) | 919 |
| Araria | 921 |
| Nalanda | 921 |
| Jamui | 921 |
| Buxar | 922 |
| Madhubani | 925 |
| Supaul | 925 |
| Sheikhpura | 926 |
| Arwal | 927 |
| Purnia | 930 |
| Gaya | 932 |
| Nawada | 936 |
| Kishanganj | 946 |
| Saran | 949 |
| Siwan | 984 |
| Gopalganj | 1015 |